Before we look at specific intraday trading strategies in detail, I have to admit I’m biased. I am quite skeptical about day-trading (and am currently not using any intra-day strategies) for several reasons:
- No basic edge: studies point to merely 5% of day-traders being consistently profitable. In contrast to long-term investing, where an unskilled advantage exists for everyone by participating in economic growth, trading is a Zero Sum Game. The average of all traders must lose by the amount of slippage and fees they pay and these are considerable for short-term strategies.
- High cost of doing business: Commissions and slippage play a large role when trade frequency is high and they take a larger percentage out of your profits, because smaller movements are traded. Overall cost can easily add up to a serious drag on returns and few day-traders ever overcome this headwind.
- Less sustainable edges: in a zero sum environment trading opportunities evolve and go through cycles quickly, so edges become harder to maintain.
- Noise overshadows signal: advantages that are pronounced at longer time horizons become more random the shorter the time frame becomes.
- Too simple: Patterns that are clear and simple have been known for ages and they should have been arbitraged away a long time ago.
- Not robust: on the other hand complex pattern and indicator combinations often rely on over-fitted backtests – optimized parameter sets are unlikely to perform as well in the future as they did in the past.
- Industry of selling secret strategies: many traders in the short-term space try to sell you stuff, often backed up by very little reliable statistical data. This, to me, is another sign of the difficulty of making money purely from trading.
- Enhanced psychological difficulties: Intense screen time is an attention grabber which compounds behavioral mistakes and distracts from productive research and development.
- Limited capacity: limits to liquidity become more pronounced in the short-term space. Slippage quickly becomes a decisive cost factor which is hard to incorporate realistically in backtests. This low capacity, however, may exclude many institutional players from using these strategies and give an advantage to smaller retail traders.
- The advantage of a reliable short-term strategy: the possibility to bet on your edge more frequently could lead to a quickly compounding returns — as you can see in the hypothetical example below.
If this return stream is uncorrelated to longer-term strategies it makes sense to add it to a portfolio.
Perhaps this skepticism serves as healthy protection when looking at the short-term trading space. It prevents me from doing too many dumb things and to take things at face value too easily.
But I’m also curious and I keep my eyes open in my research — so, when I come across empirical evidence, supported by my own tests, that something seems to work, I feel compelled to dig deeper and to put some money on the line to figure out what may be going on there. In the face of empirical evidence I will even change my mind.
Fading the Opening Gap
One strategy that intrigues me is fading opening gaps in the S&P 500 using cost-efficient, ultra-liquid futures. It buys / sells at the market open against the morning gap direction and closes the position when price retraces back to yesterday´s close. Its simplicity and pre-defined time window mitigates some of the problems inherent in intraday strategies.
Performance statistics boil down to profits and losses of equal size, with a win probability of about 60% to 70% with little optimization (see rules below). This holds up in long-term independent backtests from several sources (eg. here – with lots of strategy detail – and here), as well as in my own tests on recent data.
This simple strategy is extremely easy to execute manually, with no discretionary judgement necessary and takes just 15 minutes a day with no additional screen time after the open. Betting opportunities arise almost once every trading day, adding up to an estimated number of 100 to 150 trades per year. The strategy seems to be uncorrelated to other portfolio assets and strategies and could easily be added to a combination of investments and strategies requiring only temporary margin.
Edit after several months of live testing: Correlation seems to be an issue in real trading and the strategy had severe losing streaks in concert with drawdowns in other strategies – more details at the end of this post.
60% to 70% win probability with a reward to risk ratio of 1 : 1 is quite good for an intraday strategy.
Let’s say that there are 8-10 valid setups a month, then returns would add up to an average of 2% to 3% monthly risking 1% per trade (a fairly conservative risk level with a big margin of safety) – easily beating a buy and hold allocation to the S&P 500.
If the edge is normally distributed over time at a 66% win rate and the average profit equals the average loss including cost, then we can use the Kelly Criterion to calculate an optimal bet size. The result allows a risk of 8% per trade at a quarter Kelly — the full Kelly bet would risk a whopping 32% of your capital per trade.

Hypothetical strategy return
Say, for example, you want to make an average of $5.000 before taxes monthly – with around 9 trades per month, $22.000 of capital would be sufficient. Which, I think, is extremely unlikely to work, as it would imply a consistent return of 24% monthly. There is little evidence, that such high rate of returns over longer time periods exist in the real world (maybe with the exception of some extremely lucky examples or the untrustworthy claims of strategy sellers).
It is easy to see how such a simplistic calculation (9 trades per month with 6x 8% profit minus 3x 8% loss = 24% return) could lead to serious overtrading and a blow up as soon as the edge is not totally consistent. Things like a non-normal distribution of returns or a serial correlation between losses leading to long trends of underperformance would derail it quickly and volatility would be huge, even if the statistics were spot on.
Add to that some imperfections and mistakes in the execution of the strategy (which always happen in real trading) and we quickly return to more conservative bet sizes.
Unconstrained bet sizing is the source of many of the myths surrounding day-trading as a means to make a living off a very small capital base. It might work for a while, but it is unlikely to be sustainable over any period of time.
A simple rule of thumb is often more sensible. For example, to risk 1% to 2% of capital per trade (a very basic position sizing technique proposed by scores of trading and investment books) will make most phases of underperformance survivable as long as a long-term edge persists.
Given the performance stats above this would lead to 2% to 4% in monthly profits. Capital of $125.000 to $250.000 would be sufficient to support a $5000 a month lifestyle. That certainly seems much more realistic.
But why doesn’t everyone simply exploit such a clear edge, spending just 10 minutes a day? It is certainly not a very difficult strategy. As it is easily programmable, hordes of algos should take this obvious advantage out of the market in no time, or not? There must be an overwhelming amount of dumb money pushing prices away from the previous close at the opening, only to be faded back to the closing price 70% of the time.
Where lies the fallacy or why could it continue to work?
Robustness may be an issue. There is no real reason why the edge may not suddenly vanish or cycle on to a different strategy.
Doesn’t work across all markets. The best concepts tend to work everywhere eg. value and momentum, but the gap fade doesn´t.
No basic edge. While about 70% of overnight gaps are filled during the day, the basic return for this strategy is still zero. It needs extra rules to make money. This is quite typical for a mean reversion strategy: the size of profitable trades is defined by the size of the gaps while losses are unconstrained: rare, but large, losing trades will bring down the profitability of the strategy.
A more nuanced return profile. In live trading many trades likely will not hit the profit target nor the stop loss, resulting in a lower average profit and loss than the initial risk that was taken on each trade and therefore a lower overall return.
Popularity. The strategy is well known, but other ideas trading the opening, that often trade in the opposite direction from the same entry point, may be more popular.
The tendency for opening gaps in the S&P to close with a probability of 65% to 70% has been around for decades.
Exploring The universe of strategies using the market open
Let’s take a close look at other popular strategies, that are used by day-traders around the time of the S&P 500 market open, to get clearer picture.
The Opening Range Breakout (ORB) is probably the most well known opening strategy due to its cult status since the 1990´s, when it delivered outstanding returns. It follows an opposite concept to the gap fade, as it tries to capture a trend that develops when price breaks out of an opening trading range.
ORB enters in the direction of the opening gap right around the price at which the gap fade stops out at a loss. It can also be a continuation of the gap fade, when the closing of the gap occurs right after the open and the move continues in a trend counter to the initial gap, triggering a breakout signal.
ORB recently has had a very low win percentage around 35% (low win rates are a hallmark of trend strategies and not a real problem as long as average wins are much higher than average losses – but I would feel more comfortable with at least a 40% win rate).
From my own observations, I found a high number of false breakouts occurring at several time periods (15 minute, 30 minute and 1 hour opening ranges).
Additionally intraday trend strategies face a serious conceptual problem: At the heart of trend-following lies the concept of letting your winners run while cutting your losses short. Exiting your positions at the daily close (or earlier) curtails the chance for extraordinary winners that often make up the bulk of a trend strategy’s profits.
Several recent discussions and strategy statistics, I came across, point to the classic ORB as having been an unprofitable strategy after cost in recent years. Also, the strategy is widely available as a commercial strategy package, which is never a good thing.
Other gap strategies from the 80´s and 90´s
Entering a trade after price breaks yesterday’s close against the gap direction is a popular idea, that is betting on a continuing reversal after the gap closed. This entry point and direction exactly coincide with the exit of the gap fade strategy. (Eg. Connors/Wiliams 10% Oops which recently tests negative).
Gap continuation strategies, similar in concept to ORB, trade in the direction of the gap — stop runs on these strategies will essentially result in a closing of the gap, as stops are commonly placed on the opposite side.
Other variations:
- Return to open after 5 / 15 / 30 or 60 minutes: essentially an anti-ORB approach that looks quite promising, because of the many failed ORB breakouts.
- ORB that enters at a predetermined distance from the open (for example calculated as a percentage of the previous day´s range) at any time. Other variations add momentum and trend filters etc..
- Single Stock strategies that often screen for unusually large gaps.
Bringing it all together
An explanation for the current superiority of a gap fade strategy could be, that it takes advantage of an over-crowded ORB strategy, or other trend trading strategies around the opening range.
If so, it can be expected to be an unsustainable advantage as popularity shifts towards strategy variations that work and causes them to work less well in the future. A pure gap fading strategy seems to be too simplistic, and easily implemented algorithmically, to be sustainable over the long run.
On the other hand the effect of gaps closing with a probability of about 70% has been around for decades without any visible deterioration.
Real Life — Real Money Test
As the downside is small and the statistics are enticing with little additional effort involved (I run a daily check of my portfolio around the US open anyway), I have decided to run a real money test with a small allocation to find out what is behind this.
I will keep track of the performance at the end of this post. When the statistics drop below break-even for a period of more than a month, I plan to stop the strategy.
Rules for fading the gap
To reach the performance described above it is necessary to use screens to identify the gaps that are most likely to close, and use stop losses to protect against large trending moves as well as define the initial risk. These ideas are based largely on the excellent book “Understanding Gaps” by Scott Andrews.
I only use two essential screens to avoid over-optimization as much as possible and add some details of my own around entries and exits.
Essential screen:
- Gap size < 40% *ATR(20) (ATR = Average True Range over the last 20 days). Small gaps have a higher probability to close than large gaps.
- Inside gap: the opening price should be within the previous day´s range. The key is to avoid violent reversals where price gaps beyond the previous candle on the opposite side of the close (above yesterday’s high after down days or below yesterday’s low after up days).
- Entry at open.
- Position size: my maximum risk is 1% of capital (NAV). The distance between entry price and yesterday’s close determines the number of contacts traded: ES (S&P mini future) contracts = (NAV/(gap size in points*50))/100
- Stop Loss: at the same distance as the profit exit: entry price minus yesterday’s close.
- Exit to take profits at yesterday’s close; this gives a reward to risk ratio of 1 : 1. I put in an automatic OCO order for stop and exit and don’t actively monitor the price after the entry.
- Time exit: I close the trade after 1 PM as I think the dynamic of the gap close is over by then and we essentially face an equal probability which direction the afternoon price action will take.
Even though the strategy is as easy as can be, in real life trades are sometimes missed and discretionary elements creep in. Take responsibility, if you use these rules and expect results to differ from mine sometimes.
Performance after 4 weeks (4/12/18 to 5/9/18)
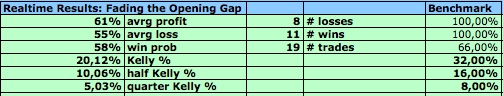
The left column shows the actual average profit and loss including fees and slippage (as a percentage of the capital at risk = 1% NAV) and the win probability, as well the resulting Kelly-optimal bet size.
On the right is the strategy benchmark derived from different backtest sources for comparison.
After running live for one month, I extrapolated an expected annual return of 18% (not compounded as many traders routinely take profits out of their account) and concluded:
A very decent return for the relatively safe level of risk taken, but lower than the results I extrapolated from external sources in the beginning of the article. For now it is a worthwhile strategy to include in a portfolio of strategies as it is using few extra resources.
Final update: Performance after 3 months (4/12/18 to 7/16/18):

The picture radically changed after 3 months as the strategy quickly turned unprofitable in live trading.
I would expect the performance figures above to add up to a loss of -7% per year at a risk level of 1% NAV per trade.
This is mostly due to my own mistakes. I’m not really suited to short-term trading: it distracts me from looking at the bigger picture and my overall portfolio by capturing a lot of my mental energy and attention.
Behavioral mistakes (eg. doubling down instead of honoring my stops) creep in, because of the overconfident illusion of being able to predict short-term movements and thus overriding the strategy.
This especially happens when I’m distracted from trading (e.g. when on holiday). As I don’t want to be a slave to such a strategy, I decided to stop it as long as losses are still moderate.
These are the statistics excluding mistakes:

There is still some edge there, but it is so slight that it will add up to no more than a return of 5% per year — the initial edge contained in a high win probability completely disappeared over the test period.
A single mistake per month (which should be expected realistically) would ruin the strategy, and that is not worth the emotional energy to me.
The Gap Fade Strategy in a portfolio context
Even if the actual return of the strategy turns out to be zero, if it is negatively correlated to the rest of the portfolio, it will still boost the overall risk-adjusted return by dampening portfolio volatility.
Unfortunately in June 2018 I observed the opposite effect in live trading: a drawdown across strategies in my portfolio deepend through a string of losses generated by the “fading the gap” strategy simultaneously.
6 comments